DEEP DIVE
Illinois Soybean Cash Price Seasonality
A historical study of farm prices received across the September to August marketing year
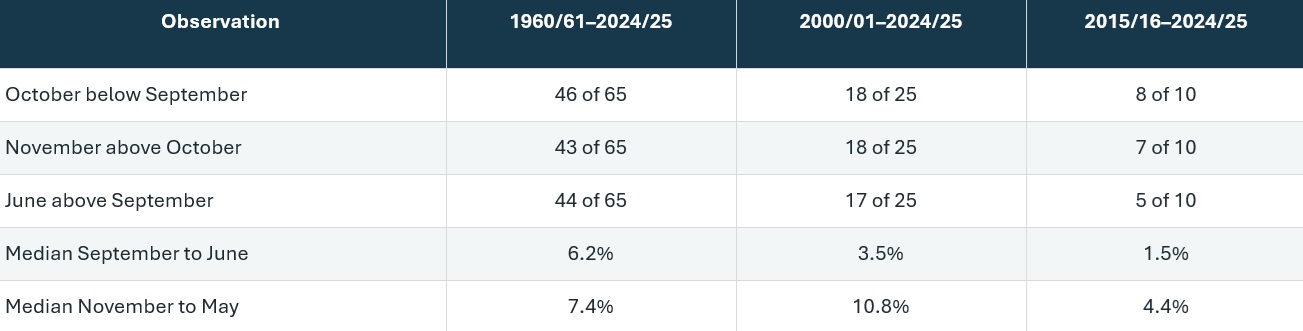
The Illinois series shows a recurring October price dip and a tendency for pricesto recover later in the marketing year. The useful commercial conclusion is narrower than a fixed instruction to store until summer. In the most recent 25 complete years, June exceeded September in 17 of 25 years, yet the median gross gain was only 3.5%. In the most recent ten, June exceeded September in five years. Any holding decision still has to clear the actual local cost of carry.
Executive findings
The long sample contains 65 complete marketing years. All percentages below describe observed nominal Illinois farm prices, before producer-specific storage, interest, handling, shrink or hedge effects.
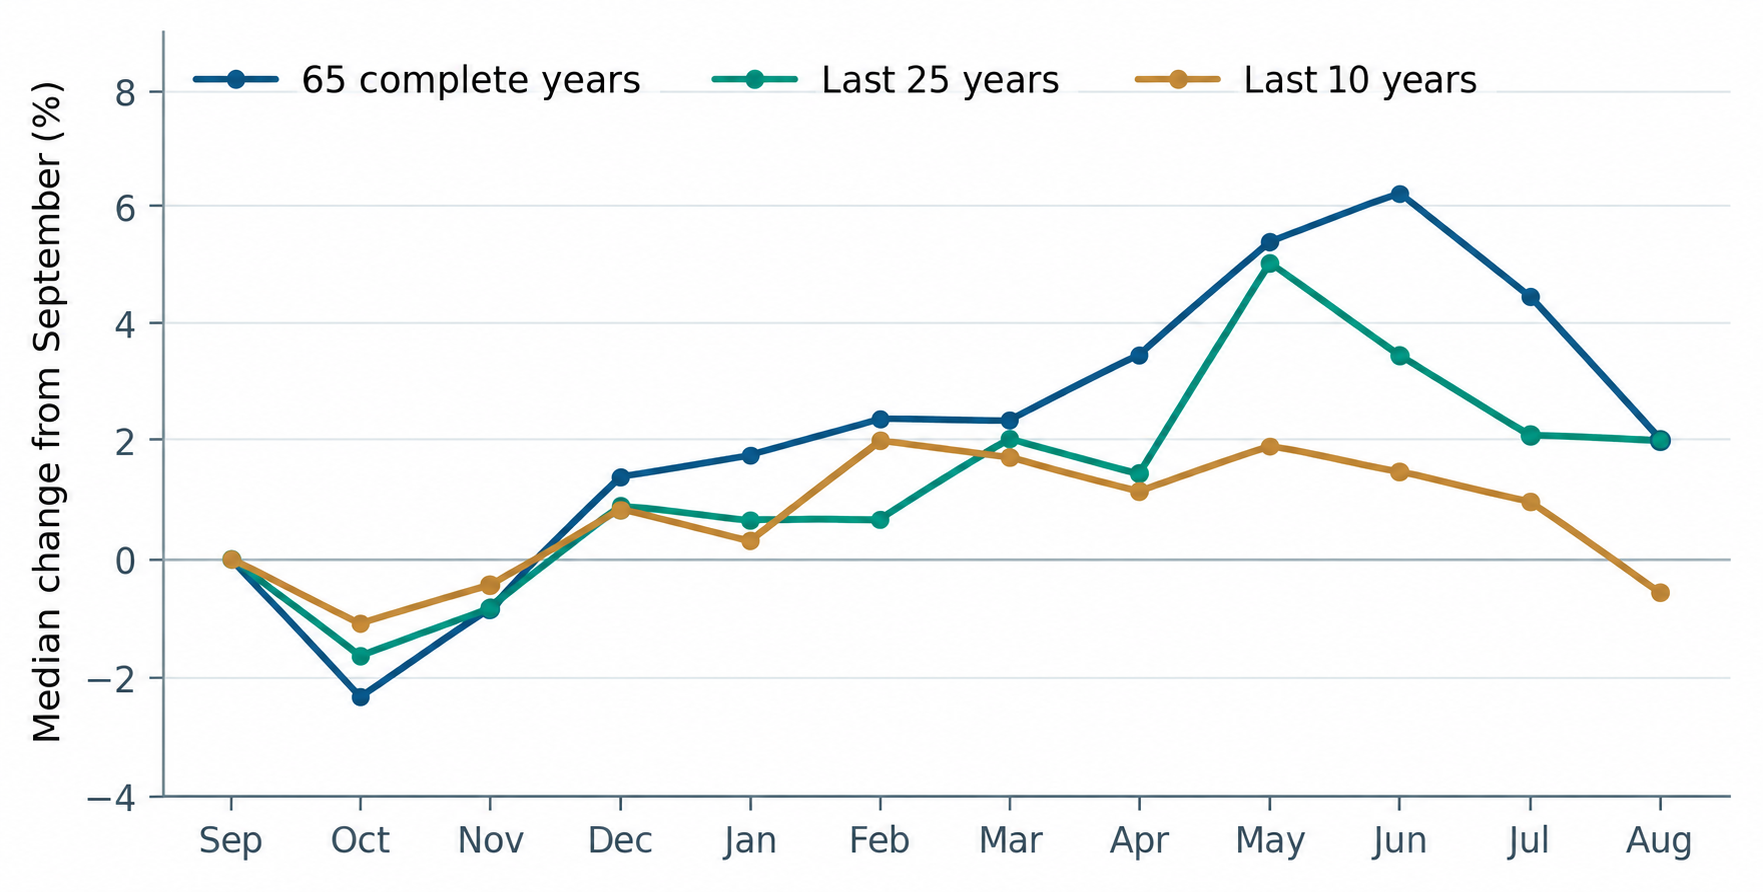
Figure 1. Median monthly farm price relative to each year's September value. Samplewindows overlap; the ten-year line is contained within the 25-year line.
Data and method
The source is the USDA Agricultural Prices report, which lists monthly average Illinois soybean farm prices received in dollars per bushel by September to August marketing year. The first full year is 1960/61 and the last full year is2024/25. Each has 12 monthly observations, yielding 780 complete-year monthly values. The workbook identifies its Average* column as a marketing-year average. That column differs from a simple mean of the 12 displayed monthly prices and is not used to calculate the seasonal path.
For eachcompleted year, I divide each monthly price by that year's September price and subtract one. This makes a $3 year and a $15 year comparable in percentage terms without letting the later, higher nominal price level dominate a pooled dollar average. The plotted line is the median of those within-year changes foreach month. The middle range is the 25th to 75th percentile across years. The path is a set of month-specific medians; it is not the realized path of one representative year.
A monthlyincrease compares a given month with the preceding month in the same marketing year. For the fixed windows, September to June and November to May, each year's endpoint price is divided by its own start price. A year counts as positive only when the endpoint is strictly higher; a tie is retained in the sample but does not count as a positive result. Where a year has equal annual highs or lows, the month-frequency chart assigns the first occurrence.
The seasonal path and its dispersion
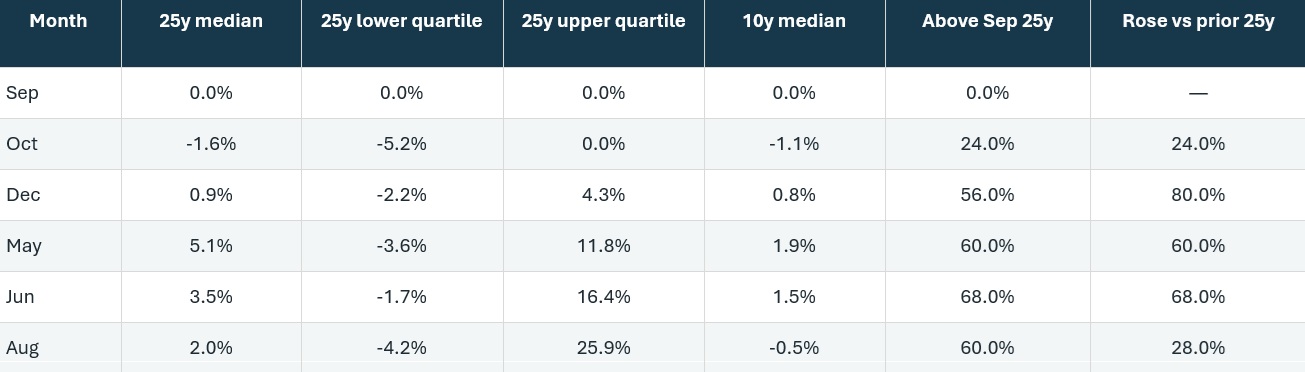
Across 2000/01–2024/25, the median path first falls 1.6% from September to October. It remains 0.8% below September in November, crosses above the baseline by December, and reaches a 5.1% median premium in May. The median is 3.5% in June, 2.1% in July and 2.0% in August. These month-by-month medians do not mean that an individual year typically rises in a smooth line. They are separate cross-year summaries at each date.
Selected monthly reference values
The quartiles and medians use each year's September price as the baseline. The last column compares each month with the prior month. The accompanying workbook contains all 12 months.
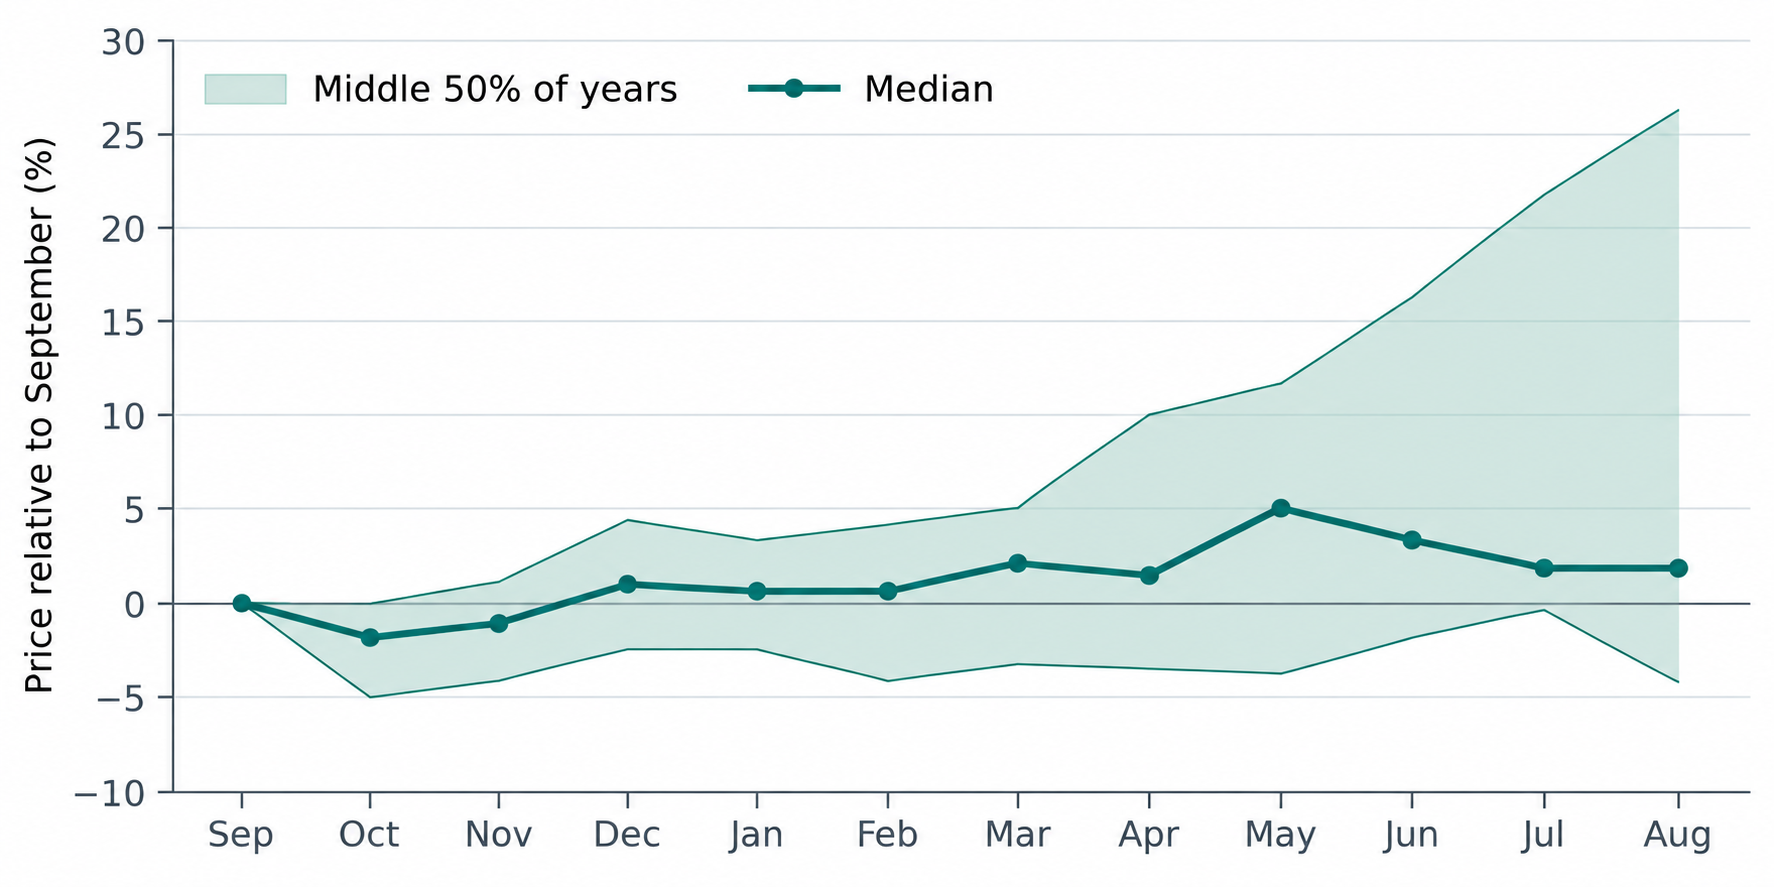
Figure 2. Median and middle half of monthly outcomes in 25 complete marketing years.Values are gross changes from each year's September price.
Dispersion grows as the marketing year advances. In June, the middle half of the 25-year outcomes ranges from 1.7% below September to 16.4% above it. By August, the corresponding range widens to 4.2% below to 25.9% above. The upper quartile climbs even though the median fades after May. Strong summer outcomes exist, but they do not describe a reliable gain for every holder.
The average can overstate the typical experience. In the 25-year sample the mean September to June change is 13.5%, nearly four times the 3.5% median. The years beginning in 2007 and 2020 gained 73.0% and 51.6%, respectively, from September to June. Removing only the 2007/08 observation reduces the sample mean to 11.0%. The median and the share of positive years are therefore necessary alongside any mean.
Harvest pressure and the winter transition
An October decline is the most repeatable short interval in this series: 18 of 25 recent completed years had an October price below September, as did eight of the last ten. The median October price in the 25-year sample was 1.6% below September. November then rose from October in 18 of 25 years. December rose from November in 20 of 25 years. Those two month-to-month observations support the description of a harvest-period dip followed by a common early recovery, but they do not identify the eventual best sale month.
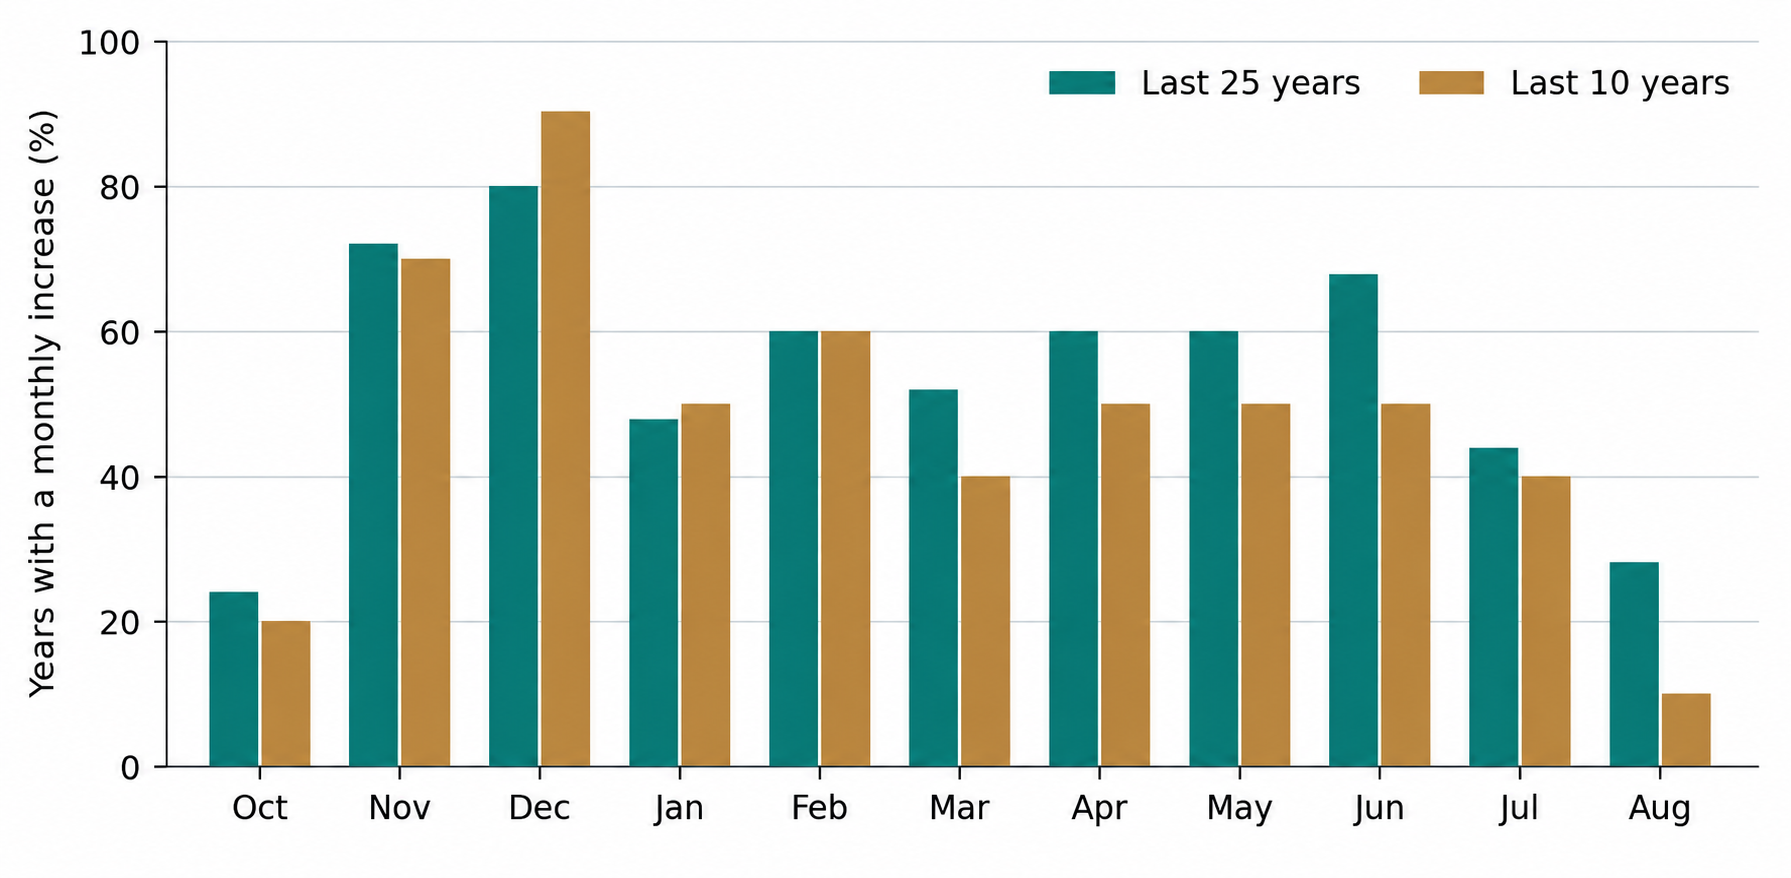
Figure 3. Share of years in which the displayed month exceeded the preceding month. October is compared with September; subsequent bars use the same adjacent-month rule.
The apparently attractive December rise should not be projected mechanically across the rest of the marketing year. The last 25 years had month-to-month increasesin only 12 of 25 January observations and 11 of 25 July observations. The month of the annual high also shifts widely. This is a seasonal tendency measured across years, not a schedule that any one price series must follow.
Fixed holding windows
Two pre-specified windows help separate a recurring price tendency from hindsight selection of each year's top. September to June represents a long hold from the beginning of the marketing year. November to May tests a later starting pointand shorter span. The table below includes both losing years and ties in eachdenominator.
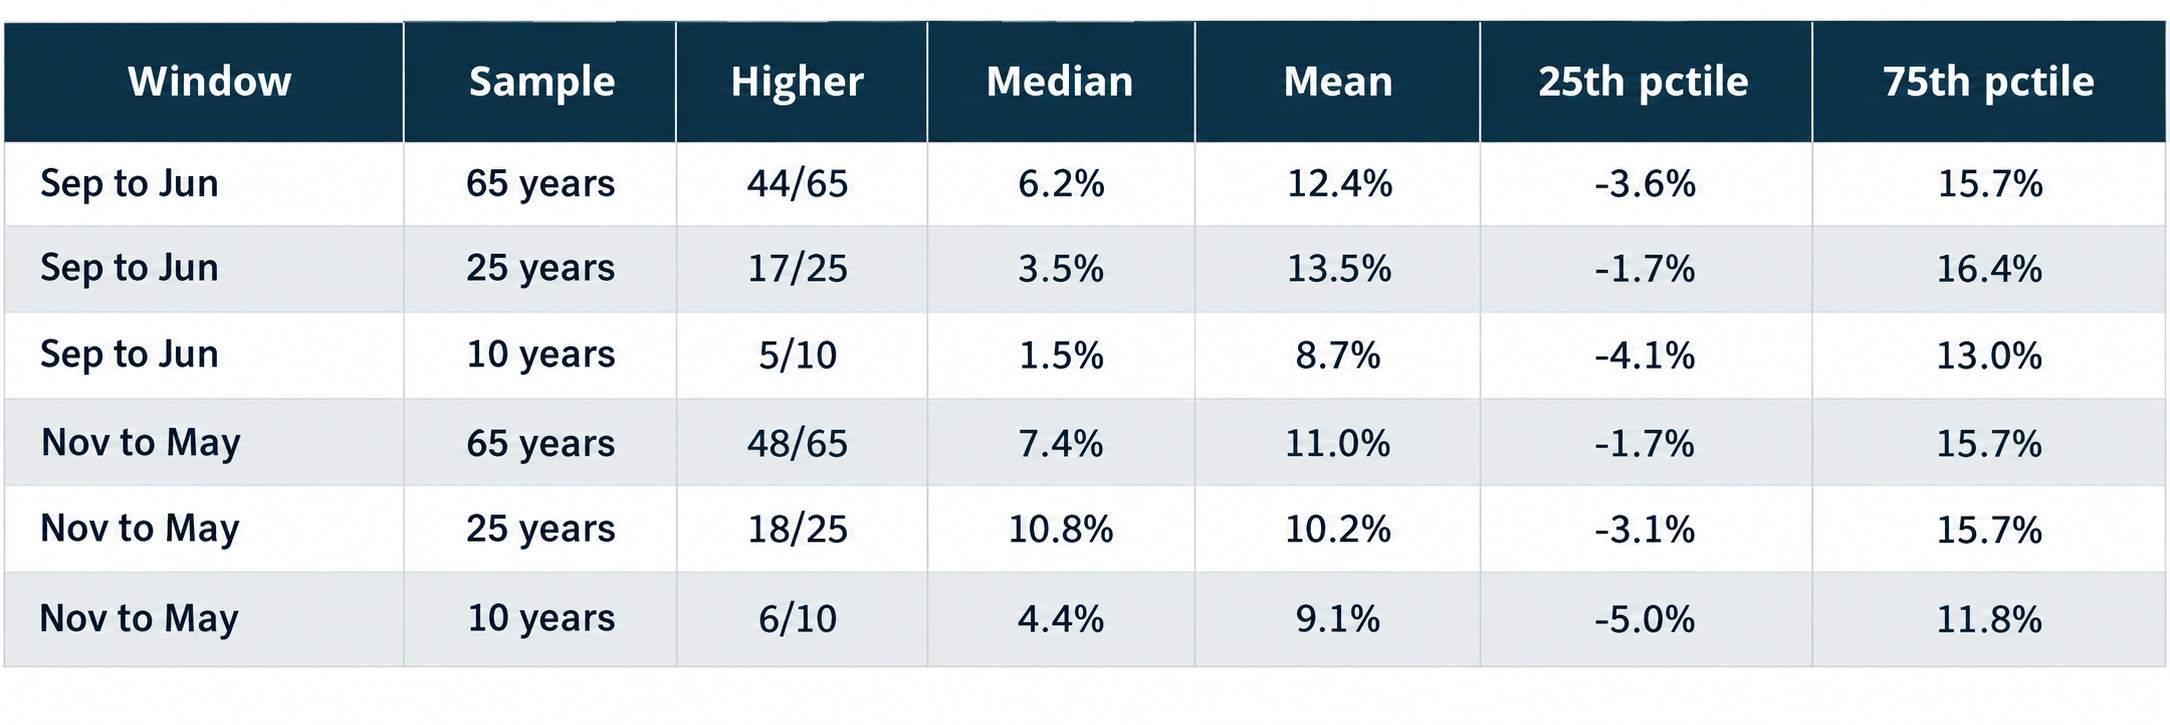
Septemberto June was higher in 17 of 25 recent years, with seven declines and one unchanged year. The 25-year median gain was 3.5%, and the median nominal difference was $0.40 per bushel. Those are two different summaries: the median of annual percentage changes and the median of annual dollar changes need not imply the same price baseline. Over the last ten years the median percentage gain fell to 1.5%, with five gains and five non-gains.
November to May looks stronger in the 25-year sample: 18 of 25 increases and a 10.8% median gain. Its lower quartile was still a 3.1% loss, and the last ten years produced six increases with a 4.4% median gain. This window begins after much of the measured October dip; it cannot be compared as an incremental return from the same September purchase or storage decision without accounting for the price at each starting month.
A 95% Wilson interval for the observed 17-of-25 September to June positive share runs from 48.4% to 82.8%. The interval for five of ten is 23.7% to 76.3%. These wide ranges illustrate the limits of small samples. They do not account for time-varying market regimes or dependence between years and should not be read as a forecast of next year's odds.
When annual highs and lows occurred
June supplied the first annual high in seven of the last 25 years. August supplied it in five. No single month was the high in even one third of the sample. May through July together accounted for 11 of 25 annual highs; May through August accounted for 16. August was also the first annual low in five years, the same number in which it was the high. Summer outcomes therefore span both ends of the distribution.
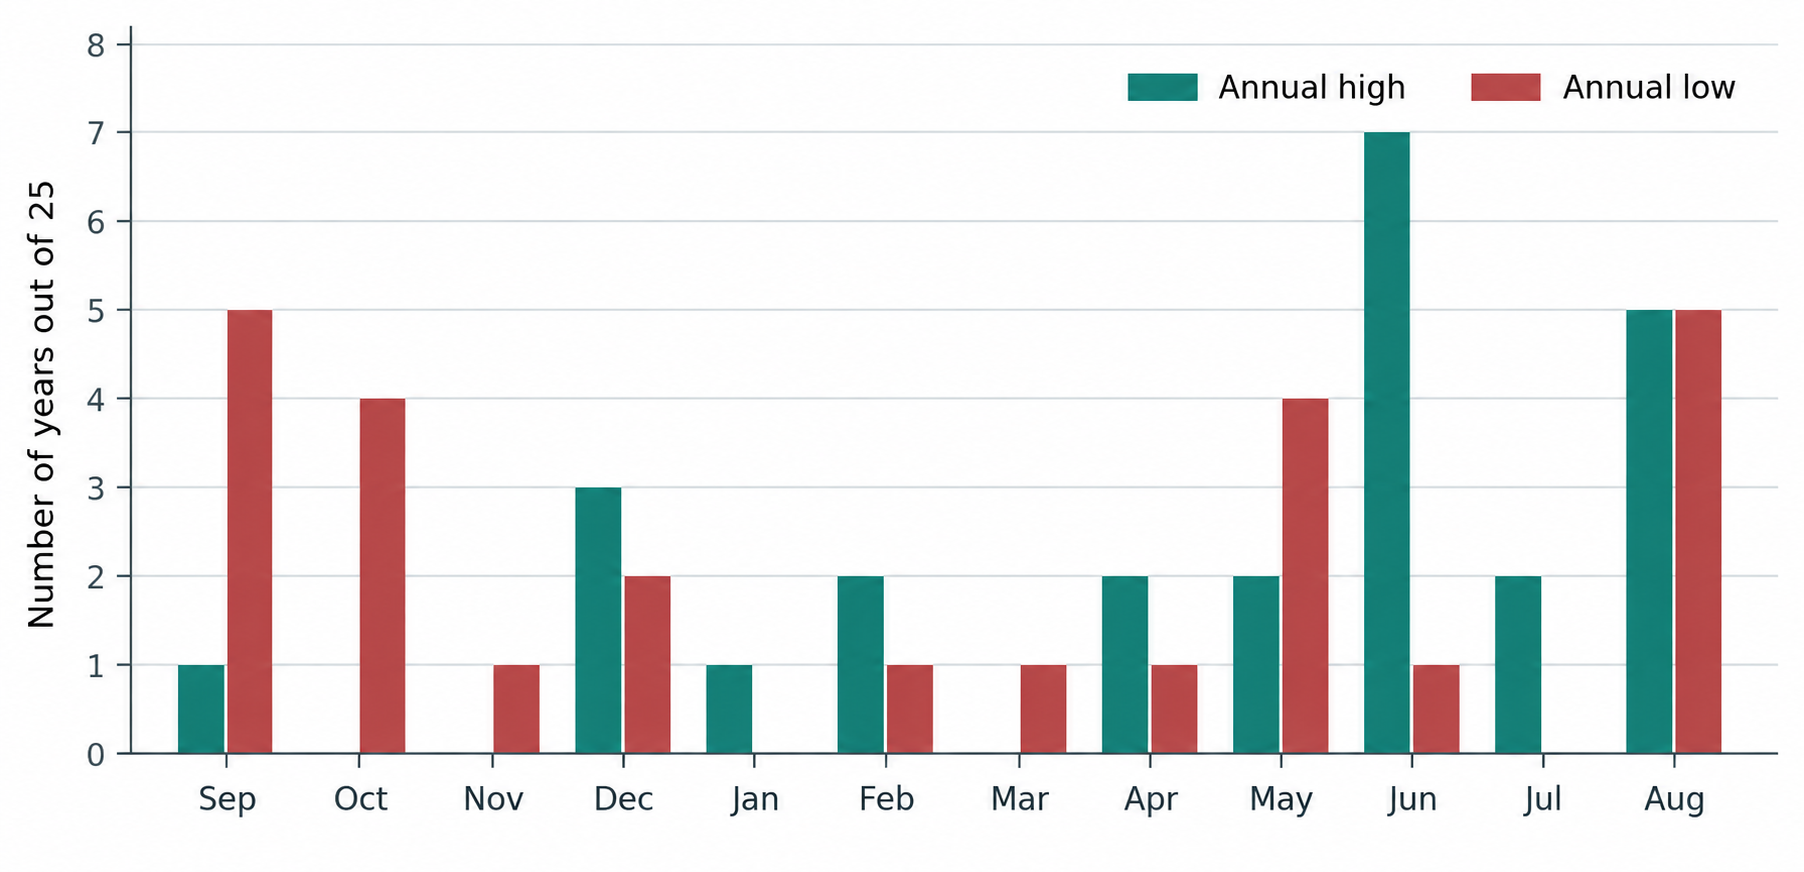
Figure 4. First month of the highest and lowest monthly average farm price within each of the 25 complete years. Ties are assigned to the earlier month.
For commercial timing, the annual-high chart has a built-in hindsight advantage: the high is known only after August. Selling at the observed high in every year is not an executable historical strategy. A fixed May, June or August sale month can be evaluated, but its actual local bid and carrying cost must be compared with the bid available when the decision was made.
How stable is the pattern
The 25-year sample combines two very different blocks. In 2000/01–2014/15, 12 of 15 years had June above September, with a 9.7% median gain. In 2015/16–2024/25, five of ten did, with a 1.5% median gain. These blocks do not overlap. The contrast explains why the 25-year median is more favorable than the most recent decade, but ten observations cannot establish that the older tendency has permanently ended.
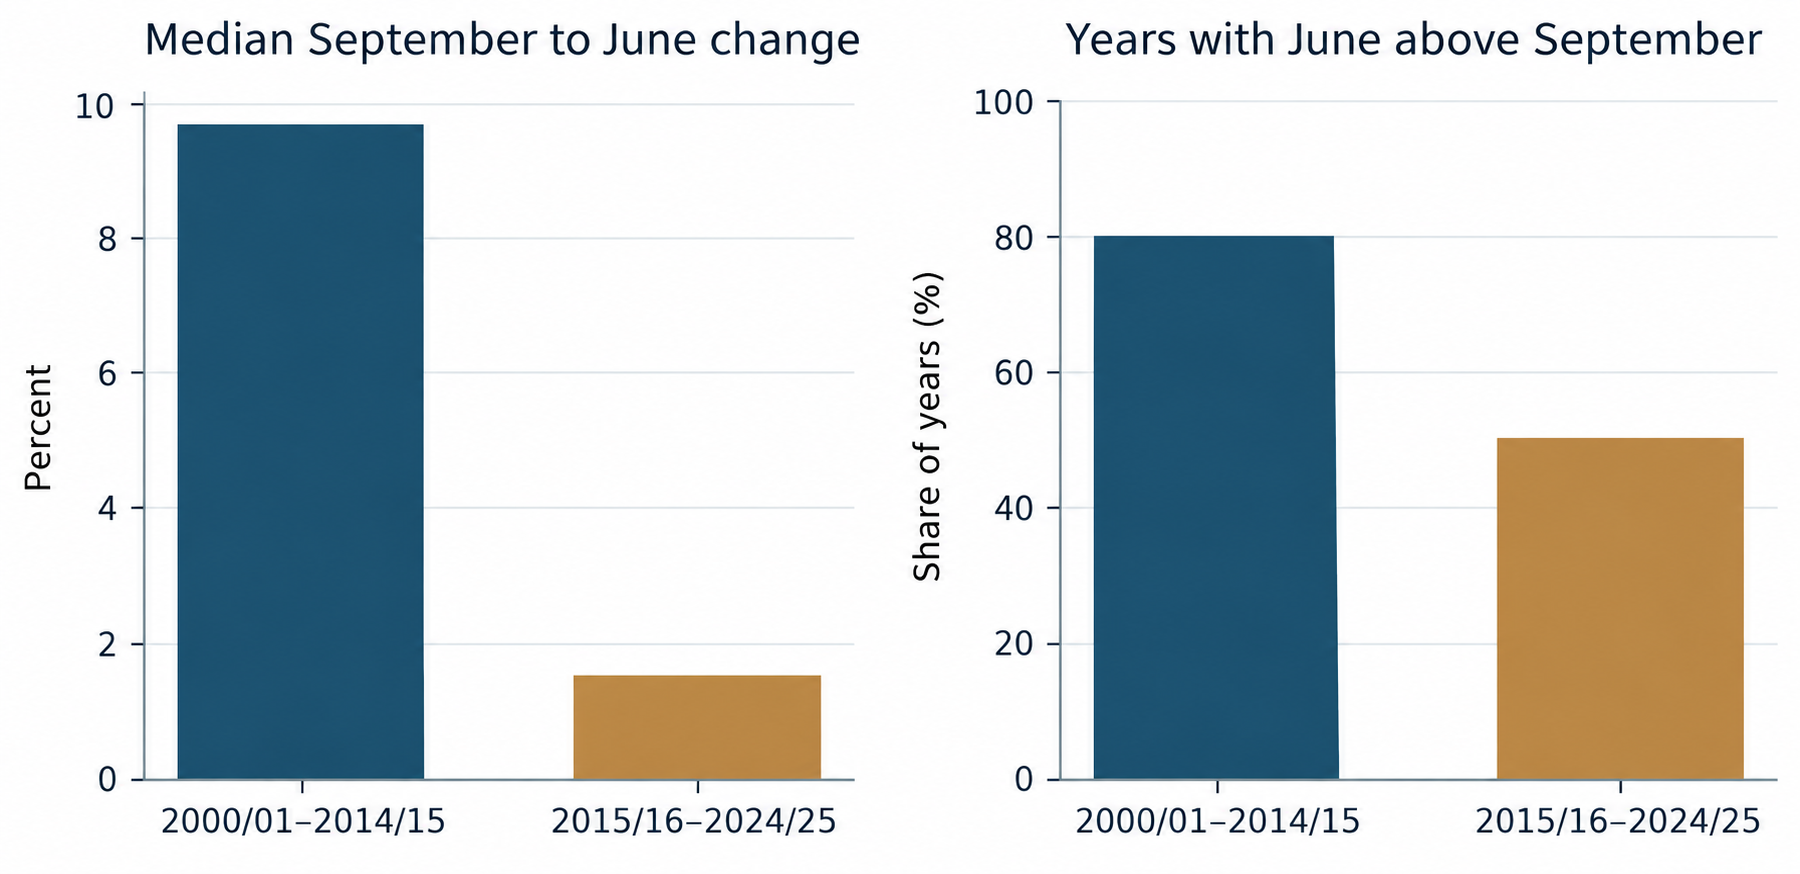
Figure 5. September to June outcomes in two non overlapping periods. The split is descriptive; it is not a formal structural break test.
The annual observations show why an average alone is an unsafe guide. September to June fell 9.9% in 2023/24, 5.5% in 2018/19 and 5.0% in 2009/10. The largest gains were 73.0% in 2007/08, 51.6% in 2020/21 and 48.7% in 2003/04. A few major upside years can coexist with a modest median and repeated negative years.
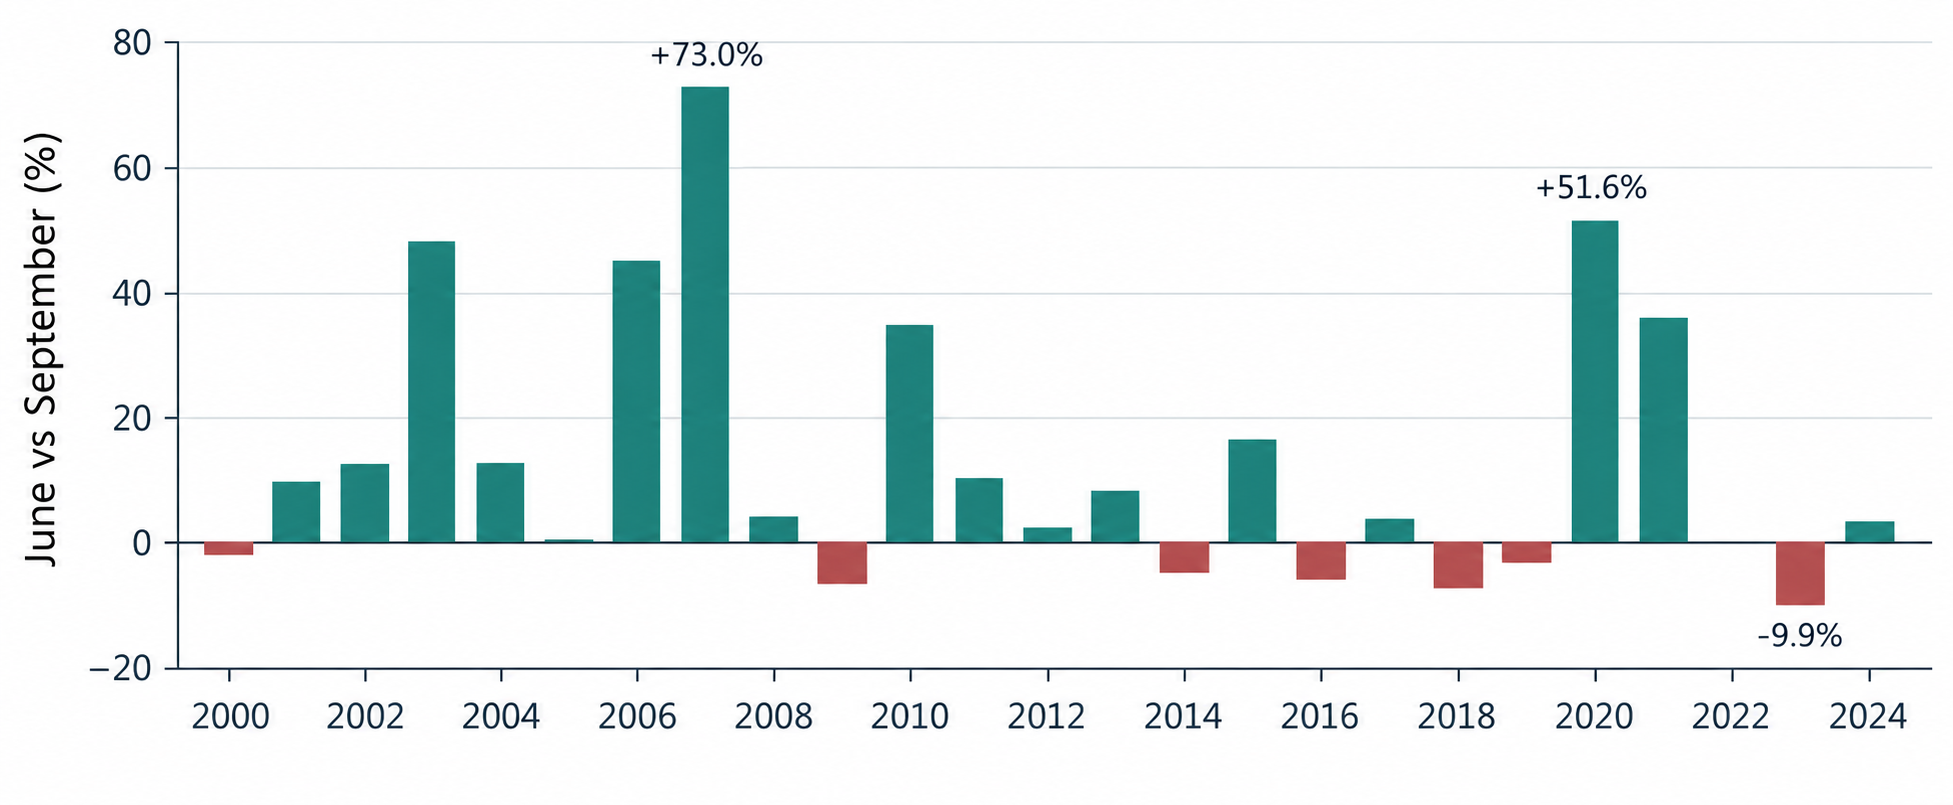
Figure 6. Observed June price compared with the same marketing year's September price for 2000/01–2024/25. Year labels identify the September starting year.
The year-by-year heatmap below adds path dependence. Several rows begin weak and finish strong; others are strong early and weaken by August. Different paths can produce the same September to June endpoint. For a holder, the intervening cash bids matter because they create opportunities to sell or lock basis before the chosen endpoint.

Figure 7. Each year's monthly cash price relative to September. Color is capped at -20% and +60% for readability; more extreme values remain in the calculations.
The partial 2025 2026 observation
The supplied workbook records $10.00 per bushel in September 2025, $9.96 inOctober, $10.60 in November and December, and $10.40 in January 2026. January stands 4.0% above September. That is above the 25-year January upper quartile of 3.3%, with 19 of those 25 completed years below the partial-year value. It is a historical placement for the five observed months, not an indication of where the remaining months will settle. No 2025/26 observation is included in the completed-year charts or frequencies.
Using the study in a sale or storage decision
A seasonal statistic becomes useful when it is compared with the alternative available today. A producer holding physical soybeans needs an expected later cash bid or a lockable forward price that exceeds today's executable cash bid by enough to pay for storage, financing, shrink, handling, quality risk and any delivery difference. The historical farm-price series does not supply those costs, a local basis history or a forward curve.
Illustrative scale. At a $10.00 September cash price, the 25-year median September to June change of 3.5% equals about $0.35 per bushel before any costs over roughly nine months. The recent ten-year median of 1.5% would equal about $0.15 at that same hypothetical starting price. Neither figure is a forecast or a guaranteed storage margin. A carrying cost above the gross difference would erase it even if that historical median repeated.
A practical comparison starts with the local September or harvest bid for the bushels in hand. Record the later delivery bid or futures hedge plus expected local basis, subtract all-in carry, and compare the resulting net value withselling now. Recheck that comparison when futures, basis, interest or storage availability changes. The October dip may support waiting for a better quote, but the cash evidence alone cannot authorize an open-ended hold.
The series is a state-level monthly average of prices received across sellers. The same lot of soybeans is not observed selling repeatedly each month. Month-to-month changes can reflect different delivery locations, contract terms, grades and marketing decisions in addition to market prices. They are a descriptive benchmark for timing, not the realized return to an individual storage trade. The study also does not isolate what portion of a cash-price move came from Chicago futures versus local basis.
Conclusions
The strongest recurring short pattern is the October dip and a common rebound into November and December. Longer holding windows have produced positive outcomes often enough to warrant examination, especially November to May in the 25-year sample. Their benefits are uneven. The September to June median gross gain was only 3.5% in that sample and 1.5% in the last decade, with meaningful downside years and wide uncertainty around hit rates.
For AgFlow's decision framework, seasonality is a prior observation to test against current cash bids, curve structure, basis, and the actual cost of carry. It can identify months worth watching and frame a breakeven hurdle. It cannot classify the present market as tight, establish a local storage return, or select a single optimal sale month on its own.
Methods and source notes
Source: Monthly Average Soybeans Farm Price Received in Illinois for the 1960/1961–2025/2026 Marketing Years. The report uses its 65 fully populated September to August rows through 2024/25; the partial 2025/26 row is discussed separately. All calculations are independently reproduced from the displayed monthly prices in the accompanying seasonality workbook.
Within-year change = later monthly price / earlier monthly price - 1. The seasonal index uses September as the earlier price. The median, mean and quartiles are calculated across years at the same month or fixed endpoint. Percentiles use the standard inclusive linear interpolation convention. Annual high and low counts choose the earliest tied month. Positives are strictly greater than zero. Wilson intervals use z = 1.96 with the historical count as n; years are treated as independent for that illustrative interval. The 65-year, 25-year and ten-year windows overlap, so their percentages are not independent tests.
Data do not include farm-level realized sales, inventories, Chicago futures, basis, forward bids or carrying costs. Prices are nominal. The results describe the supplied series and should not be interpreted as inflation-adjusted returns, expected profits from holding physical grain or probabilities conditioned on the current supply and demand state.